Products
Effects of Aeolus wind assimilation on equatorial waves:
Kelvin Waves
Longitude-pressure sections of the zonal wind perturbations belonging to Kelvin waves. Colour shadings show the differences between the observing system experiments (OSEs) with and without Aeolus. Solid lines show westerly, and dashed easterly anomalies of the Kelvin waves in the OSE without Aeolus, averaged within 5°S-5°N with contours every +- 2 m/s.
| Animation of Kelvin waves for Jul 2019 - Sep 2019 | Animation of Kelvin waves for Oct 2019 - Dec 2019 | Animation of Kelvin waves for Jan 2020 - Mar 2020 | Animation of Kelvin waves for Apr 2020 - Jun 2020 |
 |
 |
 |
 |
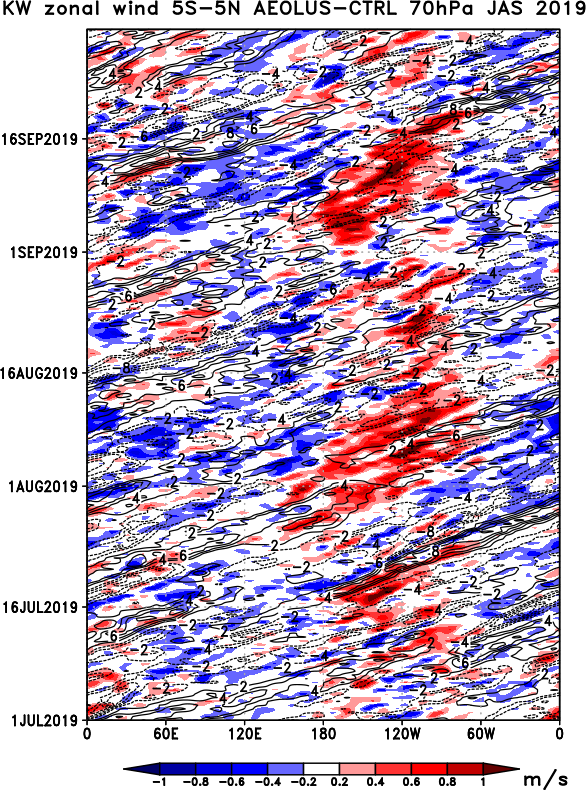
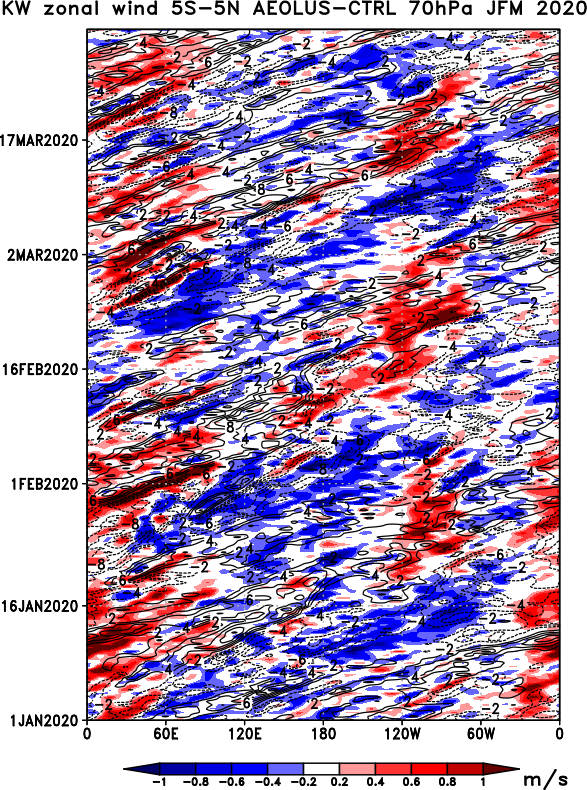
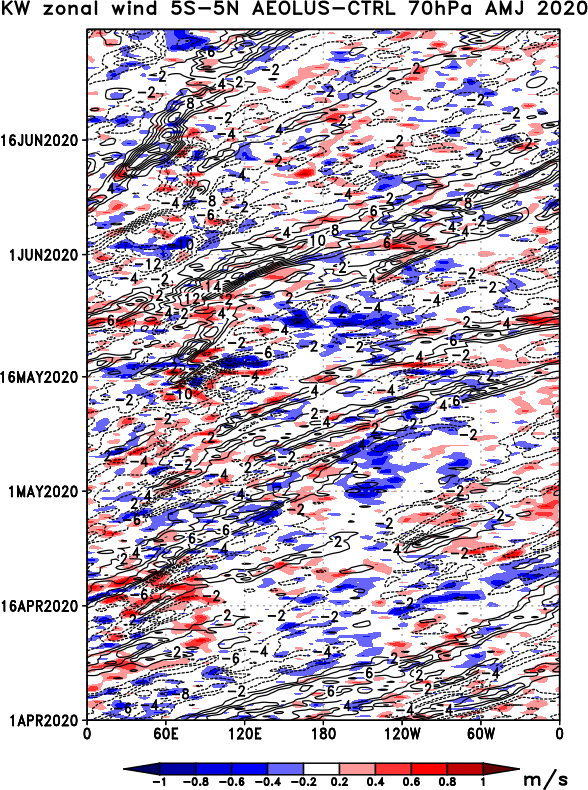
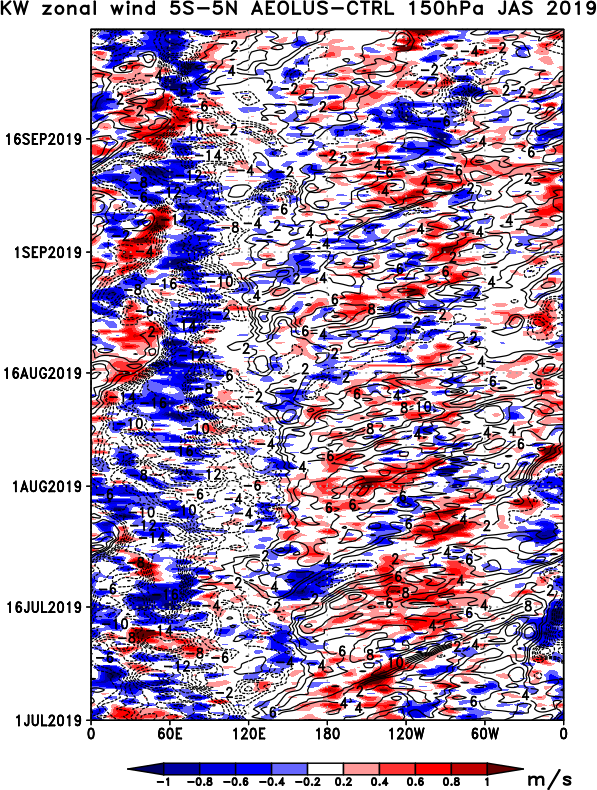
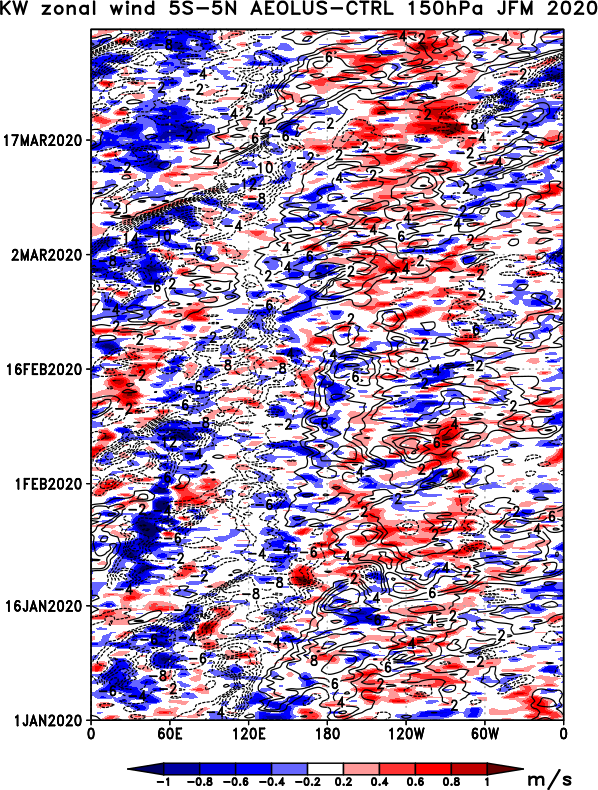
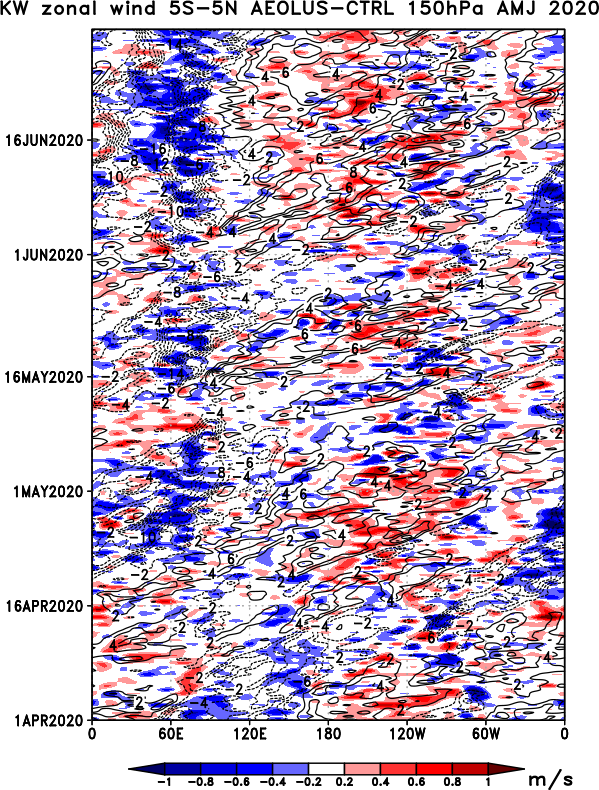
Hovmöller diagrams of the evolution of Kelvin wave zonal wind perturbations in the lower stratosphere (70 hPa) and the upper troposphere (150 hPa). Colour shadings show the differences between the observing system experiments (OSEs) with and without Aeolus. Lines correspond to the OSE without Aeolus, with contours every +- 2 m/s. Solid lines show westerly, and dashed easterly anomalies of the Kelvin waves, averaged within 5°S-5°N.
| 70 hPa Jul 2019 - Sep 2019 | 70 hPa Oct 2019 - Dec 2019 | 70 hPa Jan 2020 - Mar 2020 | 70 hPa Apr 2020 - Jun 2020 |
 |
 |
 |
 |
| 150 hPa Jul 2019 - Sep 2019 | 150 hPa Oct 2019 - Dec 2019 | 150 hPa Jan 2020 - Mar 2020 | 150 hPa Apr 2020 - Jun 2020 |
 |
 |
 |
 |
n=1 Rossby Waves
Longitude-pressure sections of the zonal wind perturbations belonging to n=1 Rossby waves. Colour shadings show the differences between the observing system experiments (OSEs) with and without Aeolus. Solid lines show westerly, and dashed easterly anomalies of the n=1 Rossby waves in the OSE without Aeolus, averaged within 5°S-5°N with contours every +- 2 m/s.
| Animation of n=1 Rossby waves for Jul 2019 - Sep 2019 | Animation of n=1 Rossby waves for Oct 2019 - Dec 2019 | Animation of n=1 Rossby waves for Jan 2020 - Mar 2020 | Animation of n=1 Rossby waves for Apr 2020 - Jun 2020 |
 |
 |
 |
 |
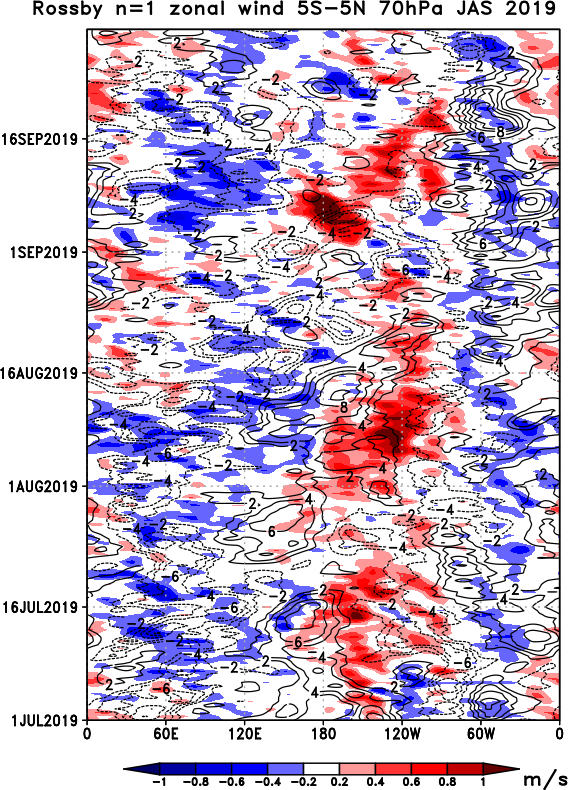
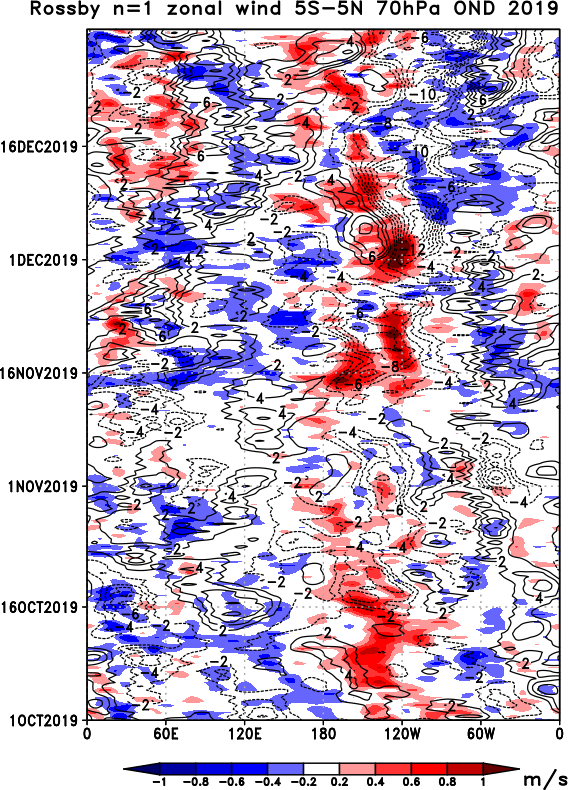
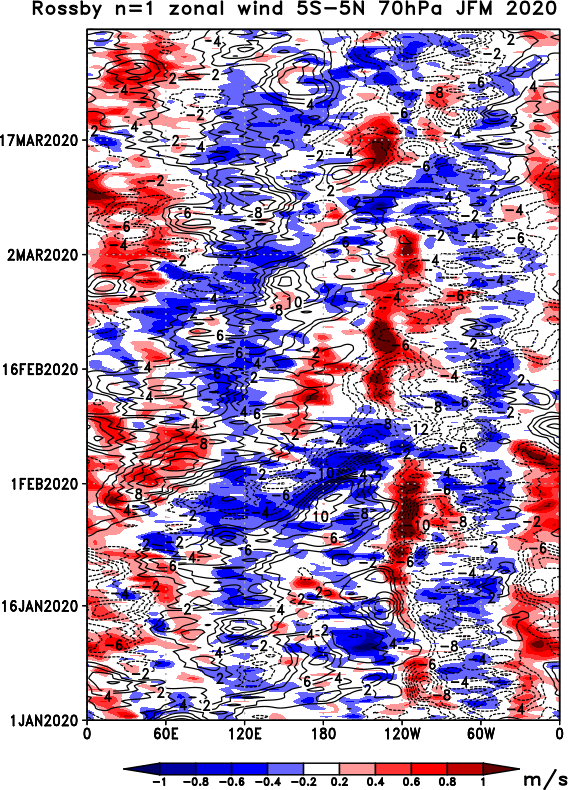
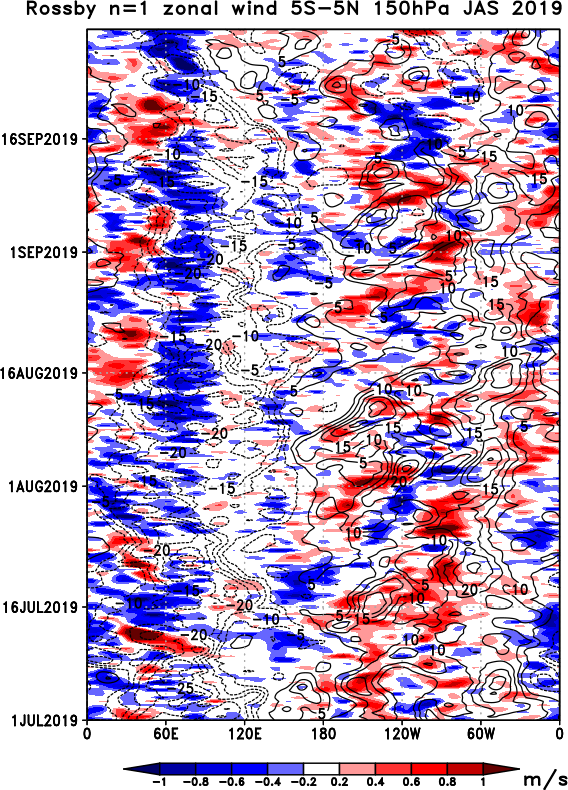
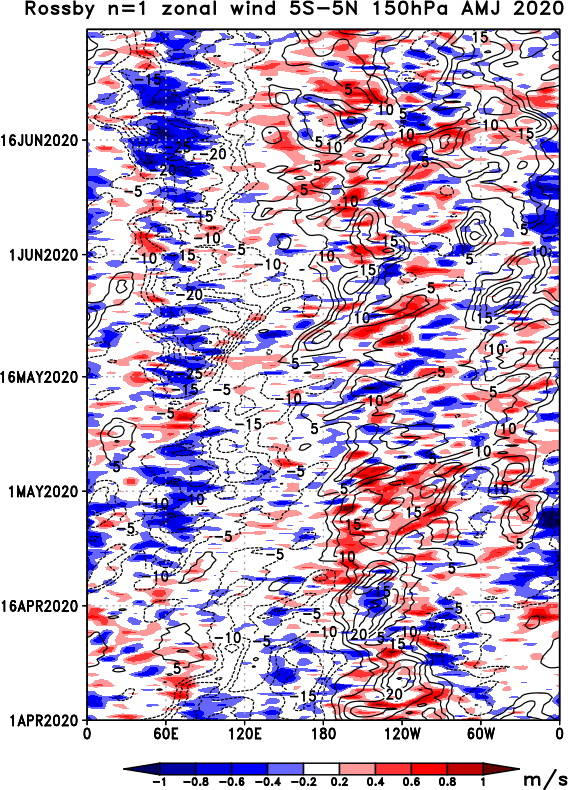
Hovmöller diagrams of the evolution of n=1 Rossby wave zonal wind perturbations in the lower stratosphere (70 hPa) and the upper troposphere (150 hPa). Colour shadings show the differences between the observing system experiments (OSEs) with and without Aeolus. Lines correspond to the OSE without Aeolus, with contours every +- 2 m/s. Solid lines show westerly, and dashed easterly anomalies of the n=1 Rossby waves, averaged within 5°S-5°N.
| 70 hPa Jul 2019 - Sep 2019 | 70 hPa Oct 2019 - Dec 2019 | 70 hPa Jan 2020 - Mar 2020 | 70 hPa Apr 2020 - Jun 2020 |
 |
 |
 |
 |
| 150 hPa Jul 2019 - Sep 2019 | 150 hPa Oct 2019 - Dec 2019 | 150 hPa Jan 2020 - Mar 2020 | 150 hPa Apr 2020 - Jun 2020 |
 |
 |
 |
 |
Mixed Rossby-Gravity Waves (MRG)
Longitude-pressure sections of the meridional wind perturbations belonging to MRG waves. Colour shadings show the differences between the observing system experiments (OSEs) with and without Aeolus. Solid lines show positive, and dashed negative anomalies of the MRG waves in the OSE without Aeolus, averaged within 5°S-5°N with contours every +- 2 m/s.
| Animation of Mixed Rossby-Gravity waves for Jul 2019 - Sep 2019 | Animation of Mixed Rossby-Gravity waves for Oct 2019 - Dec 2019 | Animation of Mixed Rossby-Gravity waves for Jan 2020 - Mar 2020 | Animation of Mixed Rossby-Gravity waves for Apr 2020 - Jun 2020 |
 |
 |
 |
 |
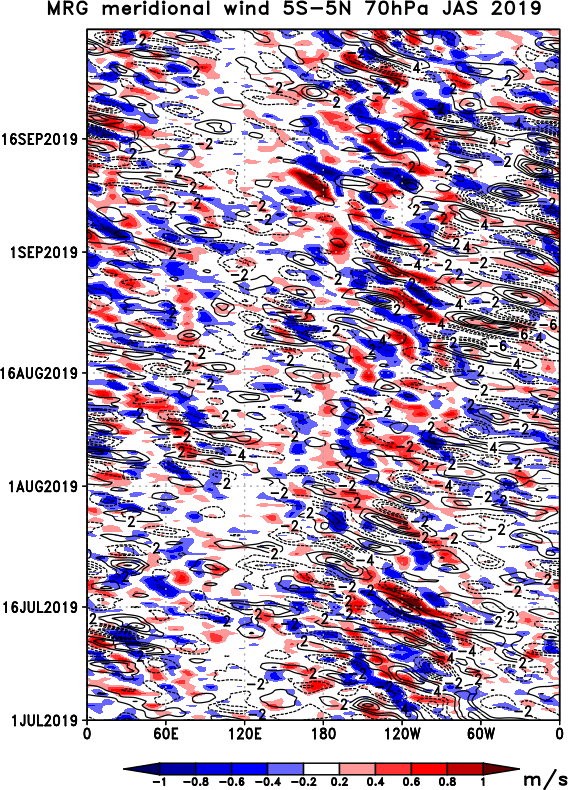
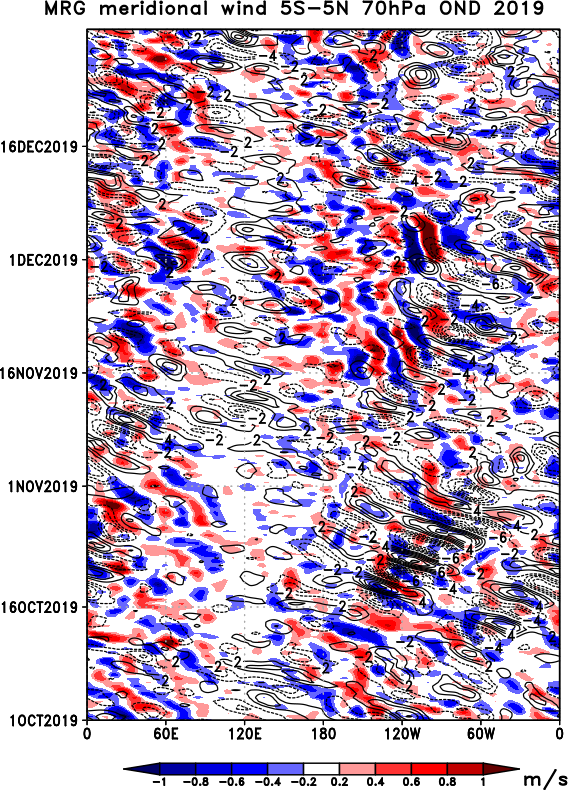
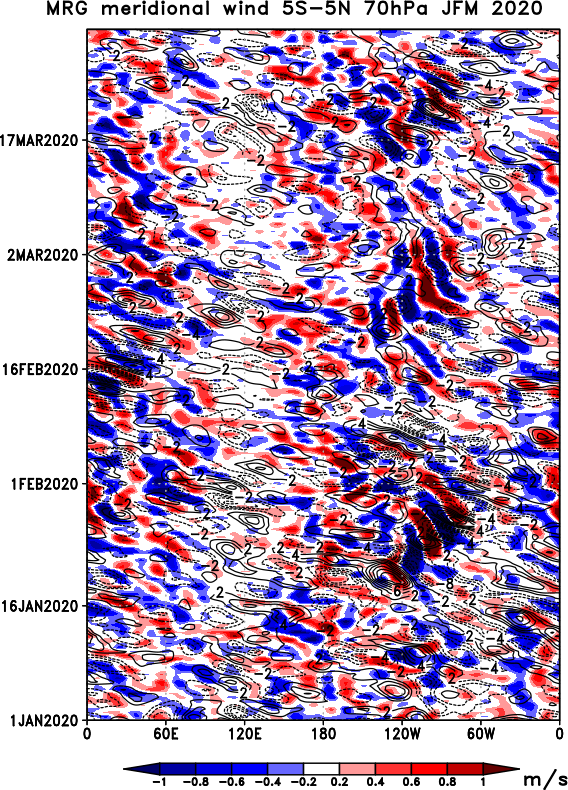
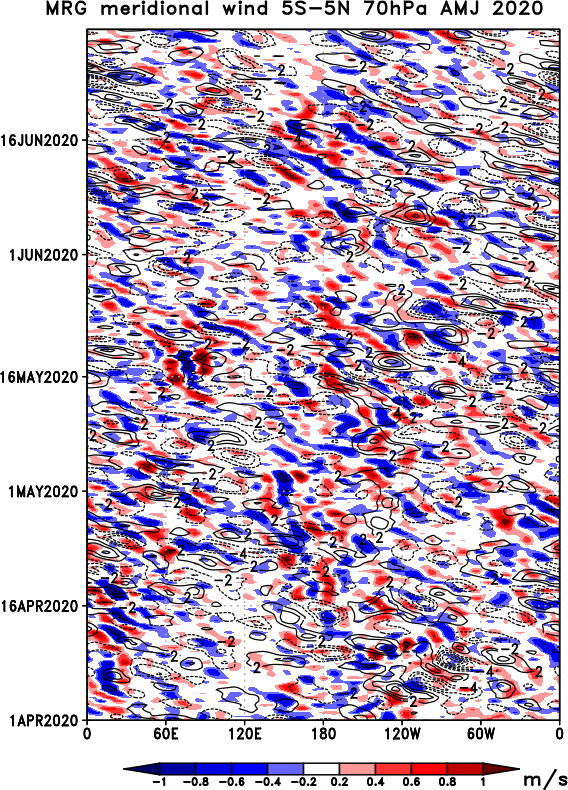
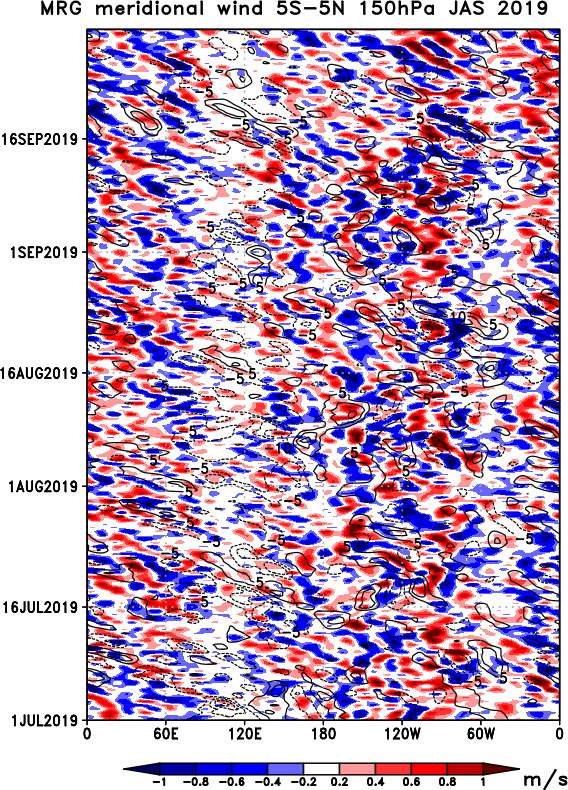
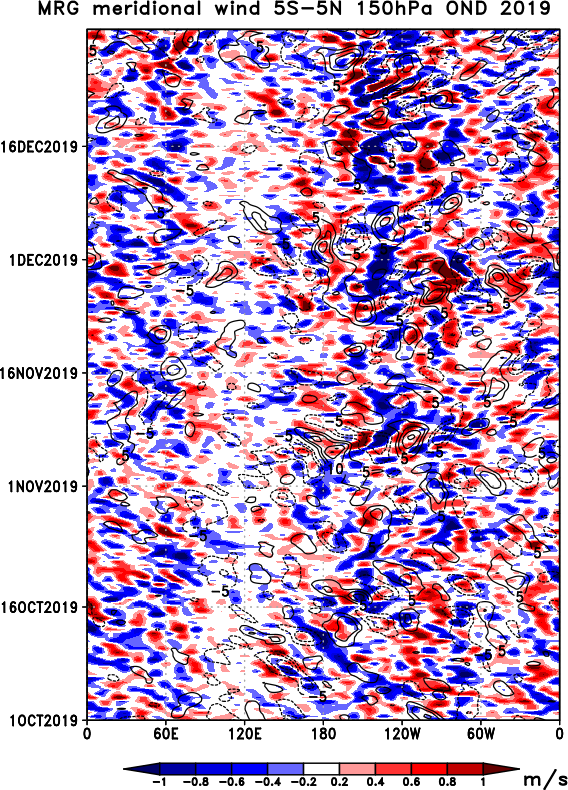
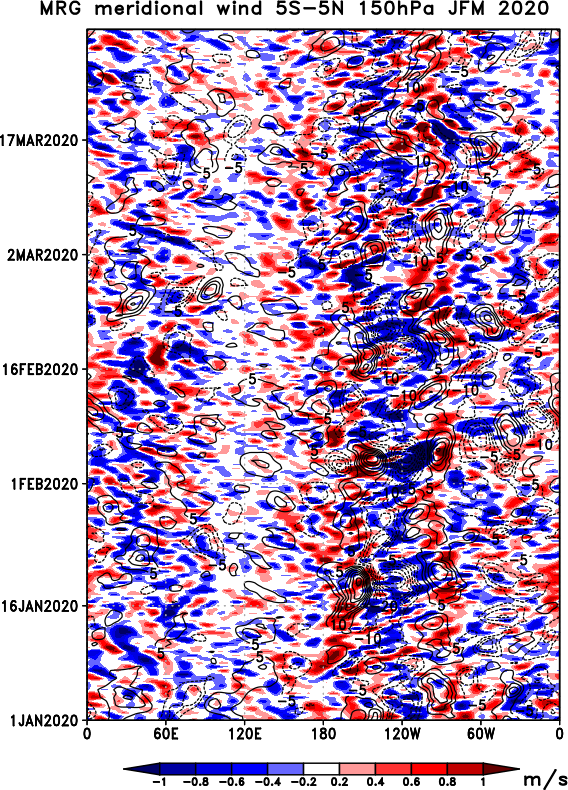
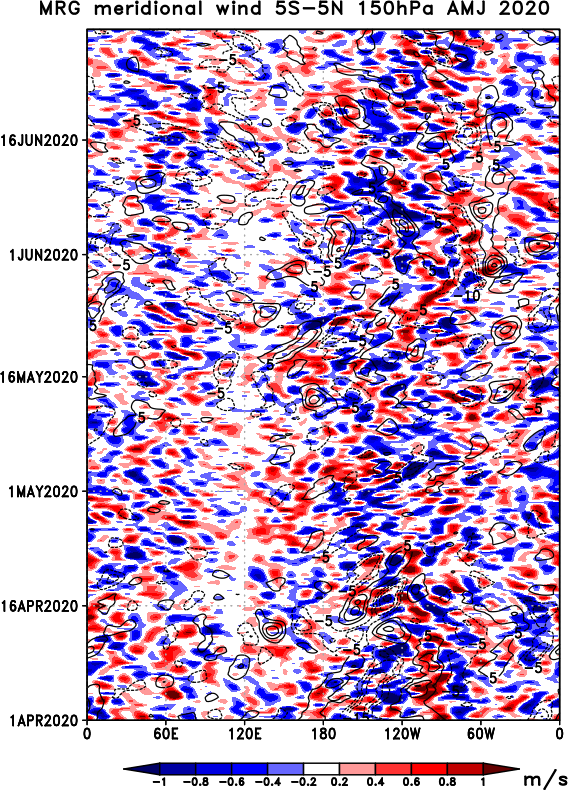
Hovmöller diagrams of the evolution of MRG wave meridional wind perturbations in the lower stratosphere (70 hPa) and the upper troposphere (150 hPa). Colour shadings show the differences between the observing system experiments (OSEs) with and without Aeolus. Lines correspond to the OSE without Aeolus, with contours every +- 2 m/s. Solid lines show positive, and dashed negative anomalies of the MRG waves, averaged within 5°S-5°N.
| 70 hPa Jul 2019 - Sep 2019 | 70 hPa Oct 2019 - Dec 2019 | 70 hPa Jan 2020 - Mar 2020 | 70 hPa Apr 2020 - Jun 2020 |
 |
 |
 |
 |
| 150 hPa Jul 2019 - Sep 2019 | 150 hPa Oct 2019 - Dec 2019 | 150 hPa Jan 2020 - Mar 2020 | 150 hPa Apr 2020 - Jun 2020 |
 |
 |
 |
 |
References
Žagar, N., Kasahara, A., Terasaki, K., Tribbia, J., and Tanaka, H., 2015: Normal-mode function representation of global 3-D data sets: open-access software for the atmospheric research community, Geosci. Model Dev., 8, 1169–1195, https://doi.org/10.5194/gmd-8-1169-2015
Žagar, N., F. Lunkeit, F. Sielmann, and W. Zhao, 2022: Three-dimensional structure of the equatorial Kelvin wave: vertical structure functions, equivalent depths, and frequency and wavenumber spectra. J. Climate, 35, 7, 2209-2230, https://doi.org/10.1175/JCLI-D-21-0342.1.