Products
Effects of Aeolus wind assimilation on equatorial waves:
Kelvin Waves
Longitude-pressure sections of the zonal wind perturbations of the Kelvin waves in the OSE without Aeolus (NoAeolus) are shown by contours every +- 2 m/s. Solid lines show westerly, and dashed easterly anomalies of the Kelvin waves, averaged within 5°S-5°N. Colour shadings show the differences between the Aeolus and NoAeolus observing system experiments.
| Animation of Kelvin waves for Jul 2019 - Sep 2019 | Animation of Kelvin waves for Oct 2019 - Dec 2019 | Animation of Kelvin waves for Jan 2020 - Mar 2020 | Animation of Kelvin waves for Apr 2020 - Jun 2020 |
 |
 |
 |
 |
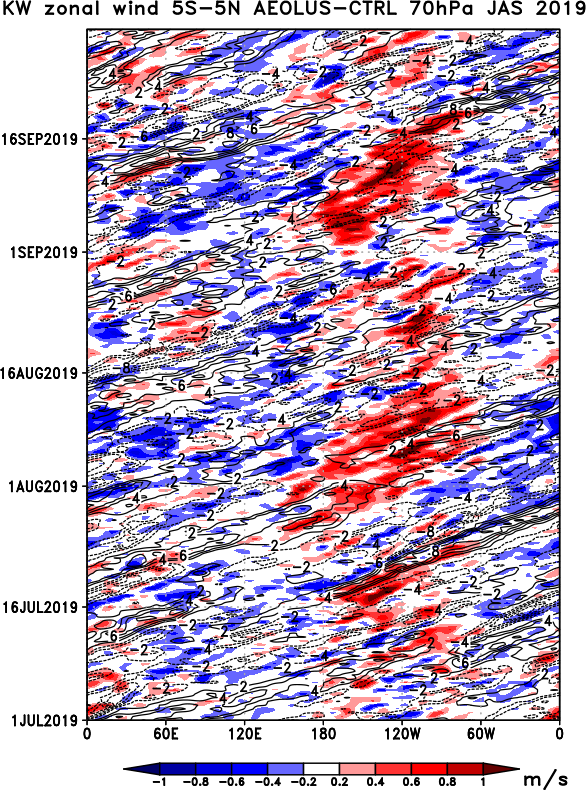
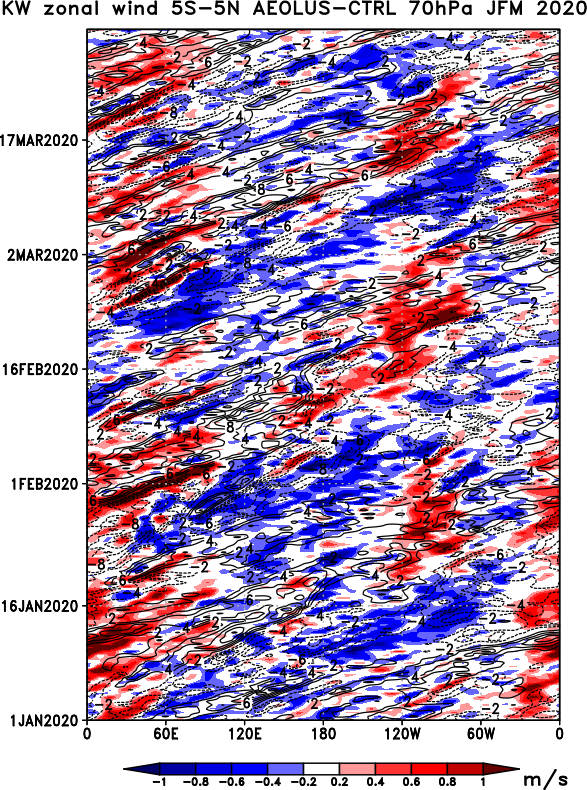
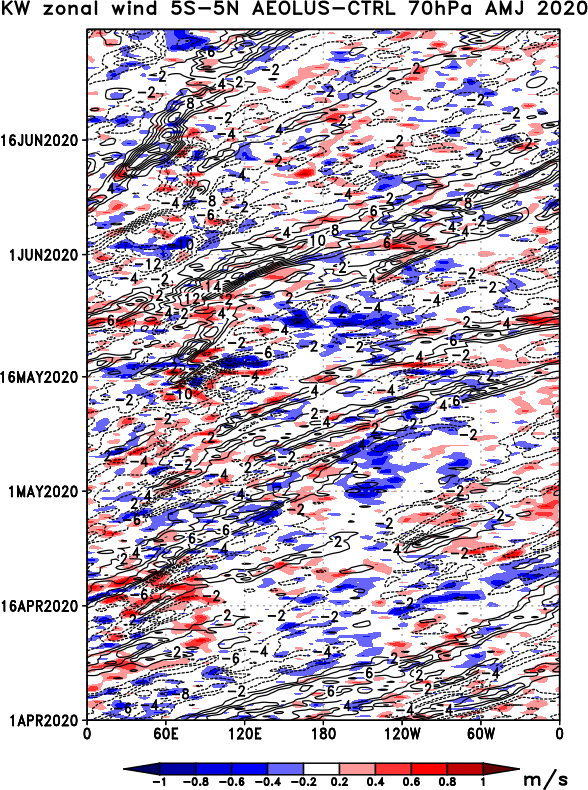
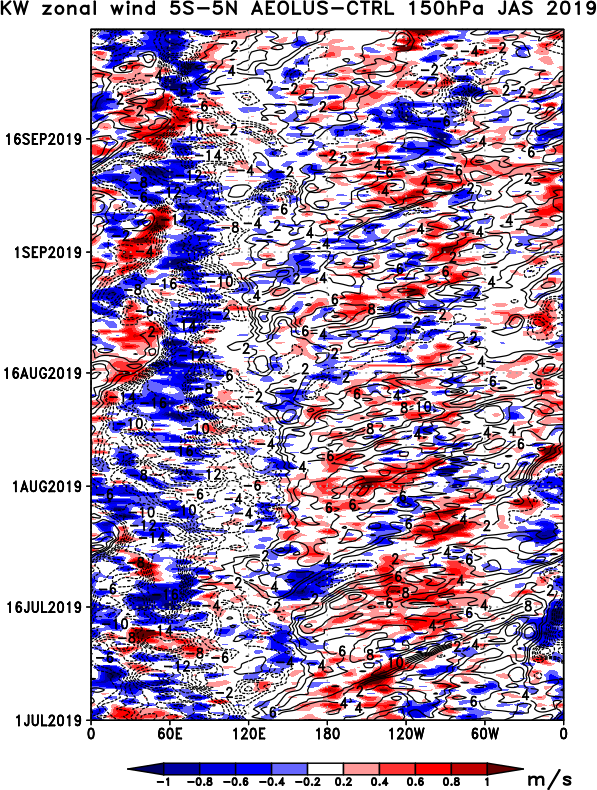
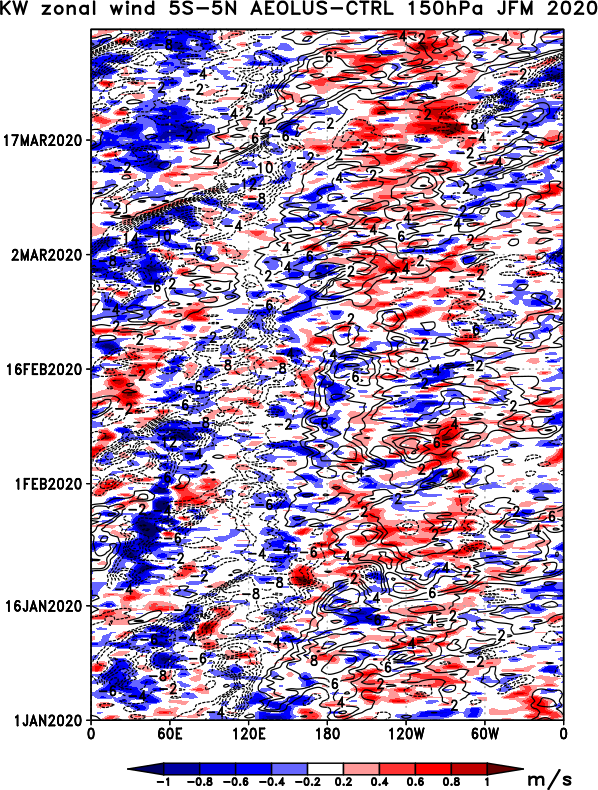
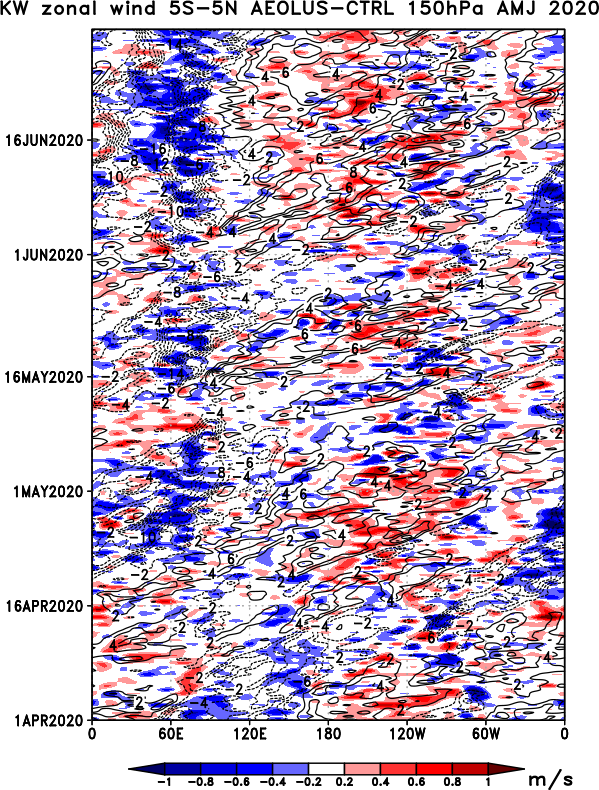
Hovmöller diagrams of the evolution of Kelvin wave zonal wind perturbations at 150 hPa and 200 hPa. Lines correspond to NoAeolus, with contours every +- 2 m/s. Solid lines show westerly, and dashed easterly anomalies of the Kelvin waves, averaged within 5°S-5°N. Colour shadings show the differences between the Aeolus and NoAeolus observing system experiments.
| 70 hPa Jul 2019 - Sep 2019 | 70 hPa Oct 2019 - Dec 2019 | 70 hPa Jan 2020 - Mar 2020 | 70 hPa Apr 2020 - Jun 2020 |
 |
 |
 |
 |
| 150 hPa Jul 2019 - Sep 2019 | 150 hPa Oct 2019 - Dec 2019 | 150 hPa Jan 2020 - Mar 2020 | 150 hPa Apr 2020 - Jun 2020 |
 |
 |
 |
 |
n=1 Rossby Waves
Longitude-pressure sections of the zonal wind perturbations of the n=1 Rossby waves in the OSE without Aeolus (NoAeolus) are shown by contours every +- 2 m/s. Solid lines show westerly, and dashed easterly anomalies of the n=1 Rossby waves, averaged within 5°S-5°N. Colour shadings show the differences between the Aeolus and NoAeolus observing system experiments.
| Animation of n=1 Rossby waves for Jul 2019 - Sep 2019 | Animation of n=1 Rossby waves for Oct 2019 - Dec 2019 | Animation of n=1 Rossby waves for Jan 2020 - Mar 2020 | Animation of n=1 Rossby waves for Apr 2020 - Jun 2020 |
 |
 |
 |
 |
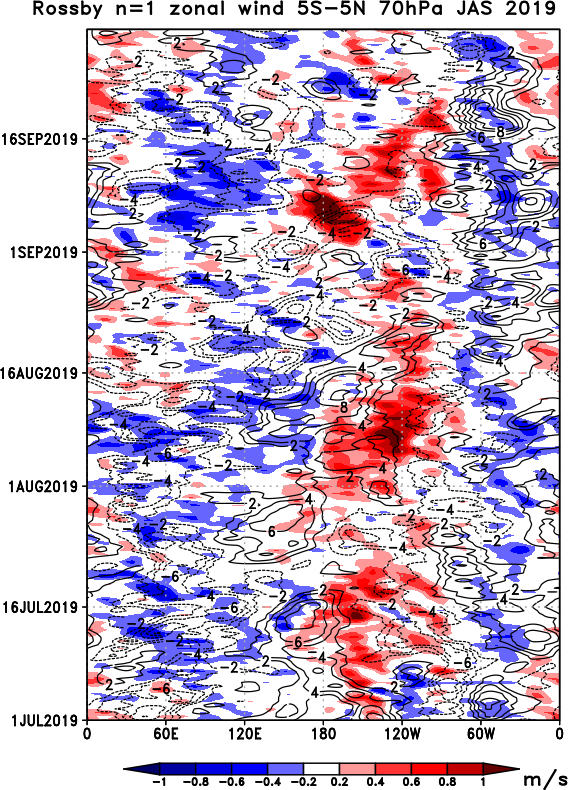
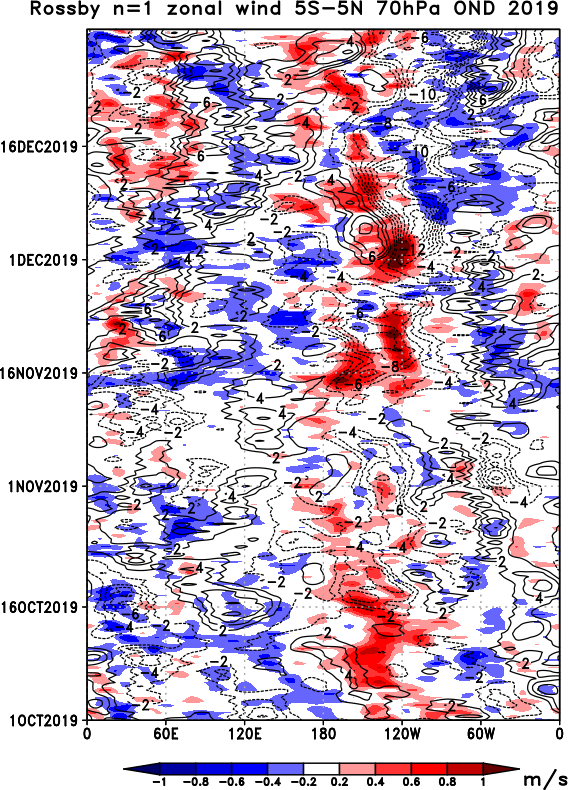
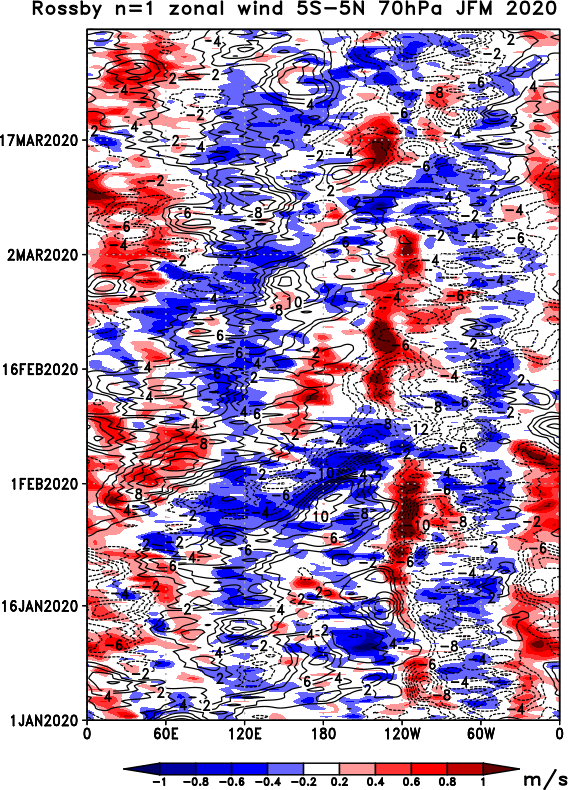
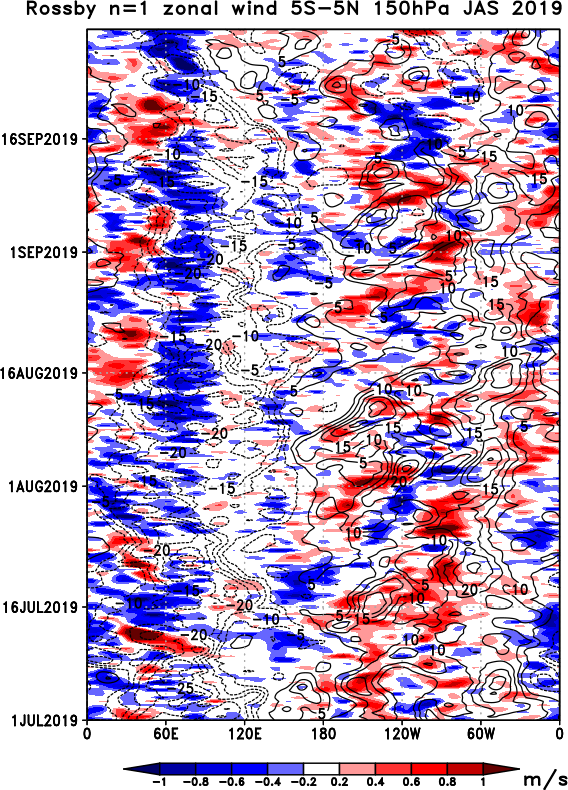
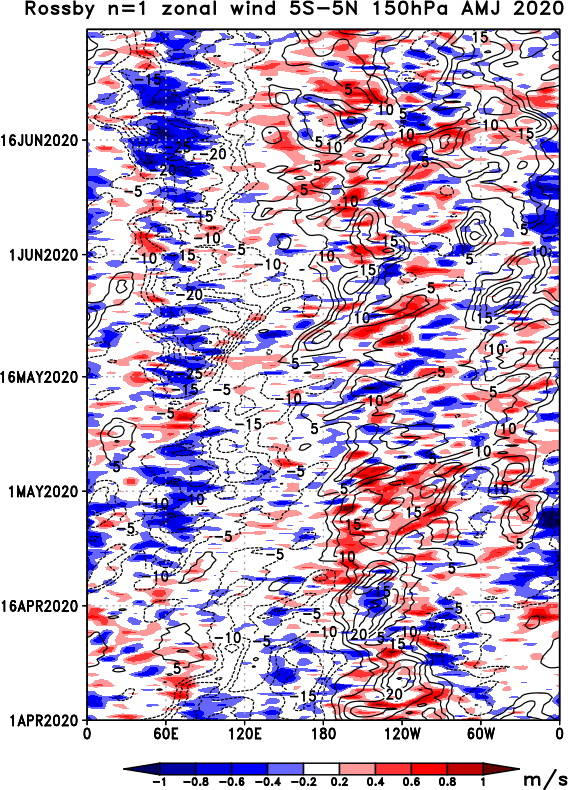
Hovmöller diagrams of the evolution of n=1 Rossby wave zonal wind perturbations at 150 hPa and 200 hPa. Lines correspond to NoAeolus, with contours every +- 2 m/s. Solid lines show westerly, and dashed easterly anomalies of the n=1 Rossby waves, averaged within 5°S-5°N. Colour shadings show the differences between the Aeolus and NoAeolus observing system experiments.
| 70 hPa Jul 2019 - Sep 2019 | 70 hPa Oct 2019 - Dec 2019 | 70 hPa Jan 2020 - Mar 2020 | 70 hPa Apr 2020 - Jun 2020 |
 |
 |
 |
 |
| 150 hPa Jul 2019 - Sep 2019 | 150 hPa Oct 2019 - Dec 2019 | 150 hPa Jan 2020 - Mar 2020 | 150 hPa Apr 2020 - Jun 2020 |
 |
 |
 |
 |
Mixed Rossby-Gravity Waves (MRG)
Longitude-pressure sections of the meridional wind perturbations of the MRG waves in the OSE without Aeolus (NoAeolus) are shown by contours every +- 2 m/s. Solid lines show positive, and dashed negative anomalies of the MRG waves, averaged within 5°S-5°N. Colour shadings show the differences between the Aeolus and NoAeolus observing system experiments.
| Animation of Mixed Rossby-Gravity waves for Jul 2019 - Sep 2019 | Animation of Mixed Rossby-Gravity waves for Oct 2019 - Dec 2019 | Animation of Mixed Rossby-Gravity waves for Jan 2020 - Mar 2020 | Animation of Mixed Rossby-Gravity waves for Apr 2020 - Jun 2020 |
 |
 |
 |
 |
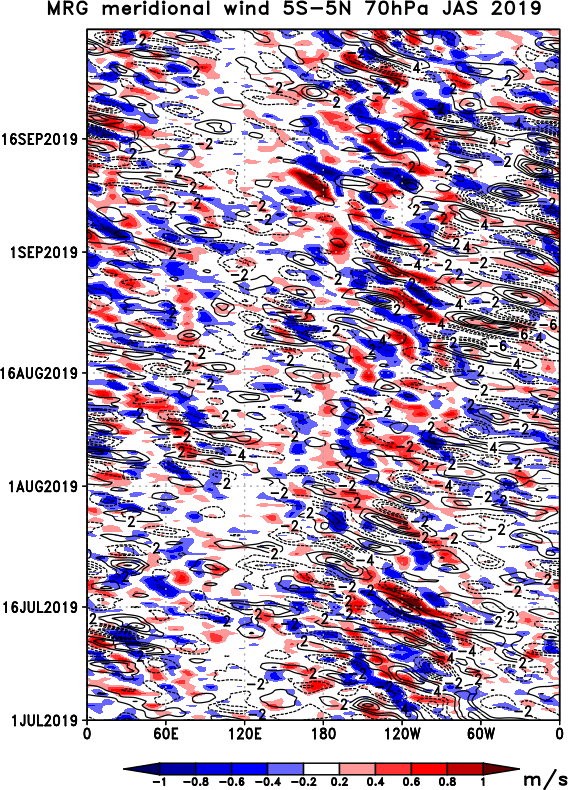
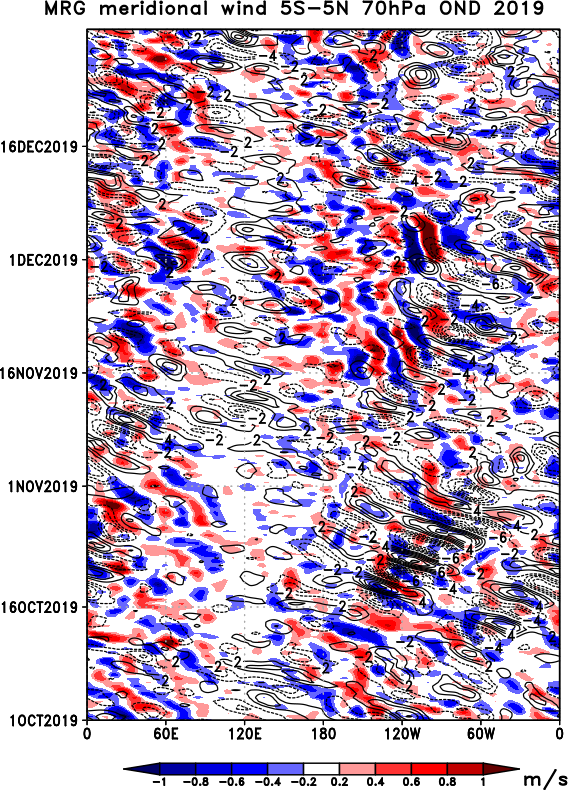
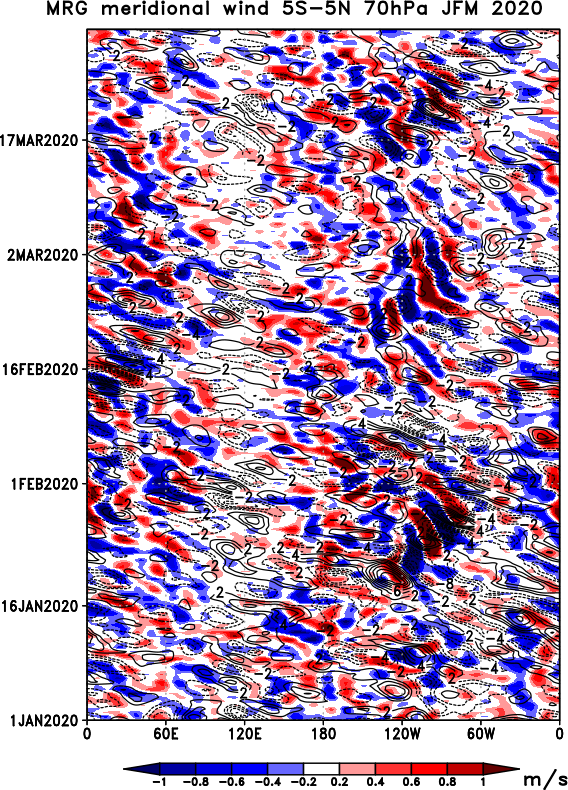
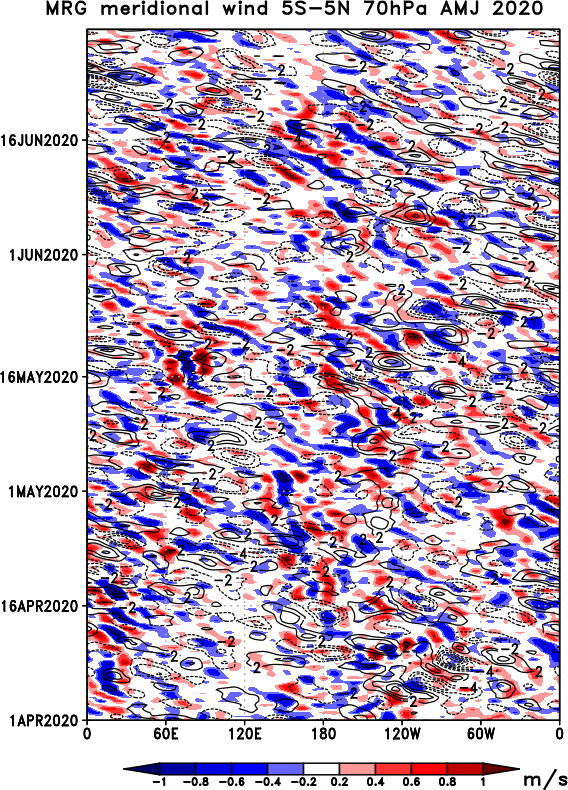
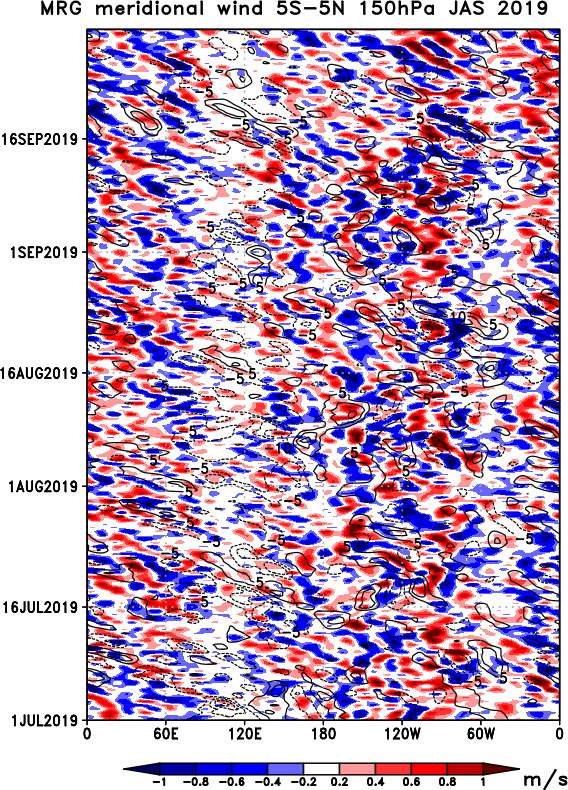
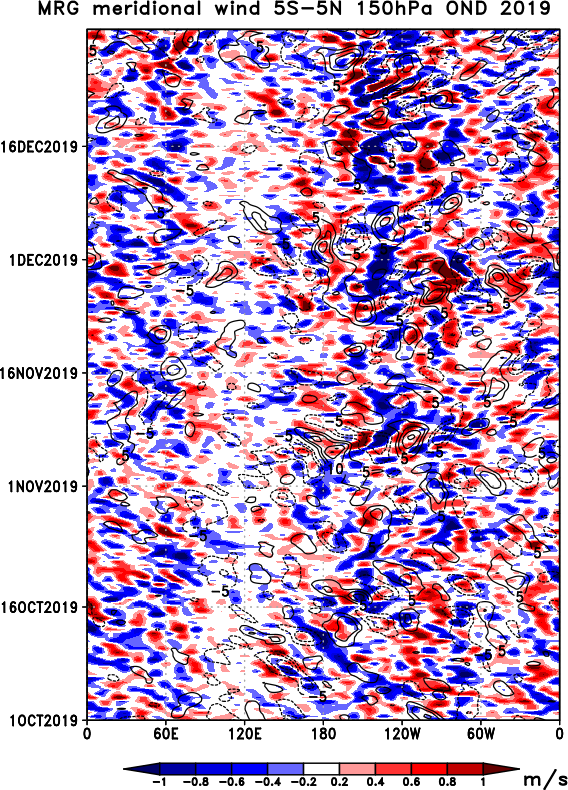
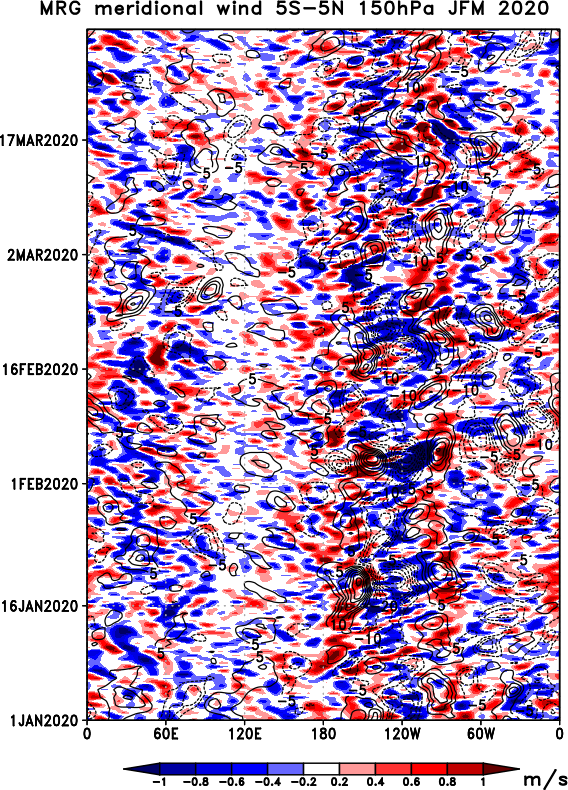
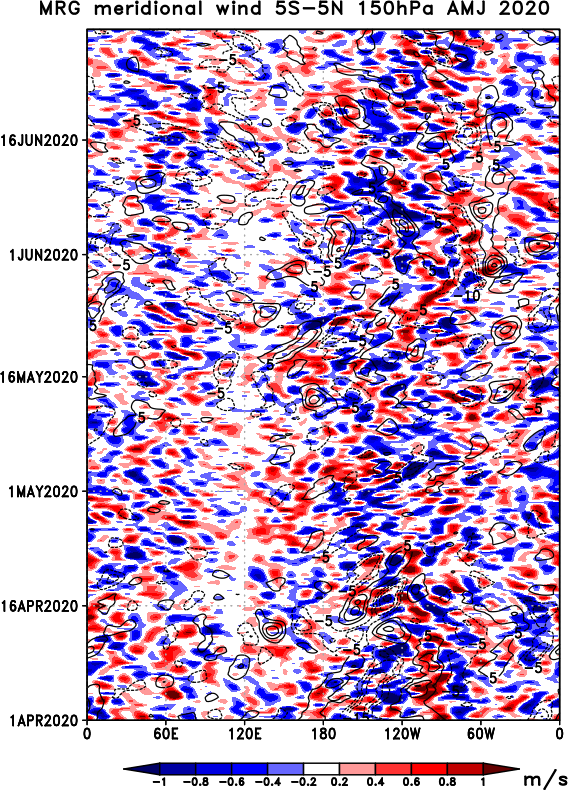
Hovmöller diagrams of the evolution of MRG wave meridional wind perturbations at 150 hPa and 200 hPa. Lines correspond to NoAeolus, with contours every +- 2 m/s. Solid lines show positive, and dashed negative anomalies of the MRG waves, averaged within 5°S-5°N. Colour shadings show the differences between the Aeolus and NoAeolus observing system experiments.
| 70 hPa Jul 2019 - Sep 2019 | 70 hPa Oct 2019 - Dec 2019 | 70 hPa Jan 2020 - Mar 2020 | 70 hPa Apr 2020 - Jun 2020 |
 |
 |
 |
 |
| 150 hPa Jul 2019 - Sep 2019 | 150 hPa Oct 2019 - Dec 2019 | 150 hPa Jan 2020 - Mar 2020 | 150 hPa Apr 2020 - Jun 2020 |
 |
 |
 |
 |
References
Žagar, N., Kasahara, A., Terasaki, K., Tribbia, J., and Tanaka, H., 2015: Normal-mode function representation of global 3-D data sets: open-access software for the atmospheric research community, Geosci. Model Dev., 8, 1169–1195, https://doi.org/10.5194/gmd-8-1169-2015
Žagar, N., F. Lunkeit, F. Sielmann, and W. Zhao, 2022: Three-dimensional structure of the equatorial Kelvin wave: vertical structure functions, equivalent depths, and frequency and wavenumber spectra. J. Climate, 35, 7, 2209-2230, https://doi.org/10.1175/JCLI-D-21-0342.1.